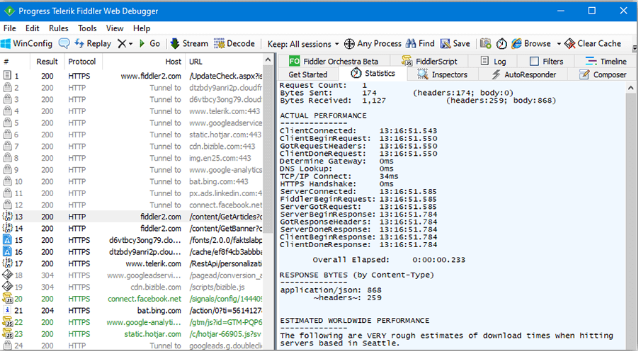
Fiddler (Chinese version of fiddler) is a web debugging proxy for the http protocol. fiddler can record and check all http communication between your computer and the internet, set breakpoints and see all the data “in and out” of Fiddler (meaning html, cookies, css, js, etc.), Fiddler (the Chinese version of fiddler) is simpler than other web debuggers because it not only helps expose http traffic, but also provides a user-friendly format. and can be extended using the .net language for: host configuration of development environments; front and back-end interface debugging; online bugfixing; performance analysis and optimisation and much more.
Update log: v5.0
1、SampleRules.js now has a window style line ending, which can be easily edited in Notepad
2、Windows 10 fixed installation issue
3、Improvement update
Software features.
1. fiddler4 supports breakpoint debugging techniques.
2. By displaying all Http communications, you can count how many times your content has been requested in total and how many bytes have been converted.
3. Users can write Fiddler extensions in any language under .
Function description.
1. Web session operation
Easily edit web sessions: simply set a breakpoint to pause session processing and allow changes to the request/response. Write your own HTTP requests and run them through Fiddler.
2. Performance testing
Fiddler allows you to see at a glance the “total page weight”, HTTP cache and compression. Isolates performance bottlenecks with rules such as “mark any uncompressed response larger than 25kb”.
3. Customisable and free tools
Benefit from a rich extensibility model, from the simple FiddlerScript to powerful extensions that can be developed in any .
4. Security testing
Decrypt HTTPS traffic and use man-in-the-middle decryption techniques to display and modify web application requests. Configure Fiddler to decrypt all traffic, or only specific sessions.
5. HTTP / HTTPS traffic logging
Use Fiddler to log all HTTP(S) traffic between your computer and the Internet. Debug traffic from almost any application that supports proxies (IE, Chrome, Safari, Firefox, Opera, etc.).
6. Web Debugging
Debugging traffic from PC, Mac or Linux systems and mobile (iOS and Android) devices. Ensure that the correct cookies, headers and caching instructions are transferred between the client and server. Supports any framework, including .
Usage.
1. Open Fiddler, find [Fiddler Options] in the upper menu bar of [Tools], and click to open it.
2. In the pop-up interface, switch the upper tab to the [Connections] option, then click the checkbox below [Allow romote computers to connect], then click the [OK] button to confirm. Click the shortcut key [win+R] to bring up the Run window of your computer. In the Run window, type in [cmd] and click OK to open the command line window of your computer.
3. In the command line window that pops up, type [ipconfig] to find the ip address of this computer.
4. Open [WLAN] in [Settings] of your android device, open the network you want to connect to, and click [Modify Network]. In the [Network Settings] window that pops up, check [Show Advanced Options]. In the advanced options, select [Proxy] as [Manual], enter the ip address of your computer in the input box behind [Proxy server host name], and enter [8888] in the input box behind [Proxy server port], and save it.
5. Open the browser in the android device, visit any page, and you can see the request and response data completed by the page in [fiddler].
After downloading fiddler4 from this website, right click and select open, the software runs in Win7/8/10 environment.
Frequently Asked Questions.
How does fiddler capture packets?
1. After developing fiddler the default is to capture packets, you can check the lower left corner of the interface to show capturing, if not, click here to start capturing packets.
2. If the website you are visiting is https, you will need to decrypt https via Tools – Fiddler Options – Https – Decrypt Http Traffic
3. Send the request through your browser. (On windows platforms this is not limited to browsers, as long as the application is sending requests via winhttp or wininet it can be monitored)
4. return to fiddler after receiving a reply to check the contents of the packet capture.
Keyword search
1. Use Ctr+F to bring up the search dialog and search for keywords globally
2. after selecting a specific request you can look for the content in the Inspecters – Raw for the specific request or reply respectively
3. If a reply is compressed, you can uncompress the content by clicking on the prompt button
Autoresponders
Request autoresponders are also widely used, for example, to dump packets from other machines into an autoresponder and then replay them locally to reproduce the problem; or in the course of dynamic debugging, if you do not want some requests to call the server, you can formulate them in the autoresponder or make the appropriate changes to see the results directly.
1. Switch to the AutoResponder tab
2. Select Enable automatic responses
3. Click on the Import button to import the captured saz file
4. You can change the request matching rules via the default Url or via the Rule Editor
Breakpoint settings
1. Set breakpoints via Rules – Automatic Breakpoints – Before Requests/After Response.
2. Breakpoints are triggered after a request or response is received and can be dynamically modified to perform different tests.
Customised extension scripts
Fiddler supports extensions via Jscript, such as automatic processing of requests and replies via scripts. Examples can be found in the example code provided by fiddler.
//www.fiddler2.com/Fiddler/dev/ScriptSamples.asp
Editor’s comment.
The more you know about the HTTP protocol, the more you can master the use of fiddler. The more you use fiddler, the more it will help you understand the HTTP protocol. fiddler is a very useful tool for developers and testers alike.


